This is Part Four of a four-part series of internal blogs from the Advanced Technology Group to discuss the chemistry of Dry Hydrogen Peroxide (DHP®). This series consists of the following topics:
- Part 1: What is DHP?
- Part 2: Why is DHP more reactive than aqueous H202?
- Part 3: How do we know we produce DHP vs. wet (aqueous) H202?
- Part 4: How do we measure DHP?
In parts one and two of this series, we discussed the reactivity difference between aqueous H2O2 compared to dry H2O2. however, how do we know that we are producing dry H2O2 instead of the aqueous version of it? Parts three and four of this series discuss this in detail with this entry focusing on how Synexis measures the concentration of DHP that is produced by our units.
In Part Three, we discussed how we use absorbance spectroscopy to differentiate between aqueous versions of hydrogen peroxide and the dry version of hydrogen peroxide. This same technique is used to quantify the amount of DHP that our units produce.
Measuring DHP
Beers’ Law (Eqn 1) dictates that the absorbance of light (A) is equal to the ability of a material to absorb that light at a specific wavelength (e), the pathlength of the cell through which the light passes (b) and the concentration of the material through which the light passes (C).
Eqn. 1: A = εbC
In image “1.1” on the left-hand side of Figure 1 – light passes through a cell of length ‘1 cm’ and interacts with ‘7’ molecules of H2O2 and will have an absorbance value of A = 7 molecules/cm. By doubling the pathlength of the cell for the same concentration of material – the light will now pass through ’14 molecules of H2O2 as shown in “1.2,” so that the absorbance value of A = 7 because the pathlength of the cell has increased by 2x. Image “1.3” then shows that by doubling the concentration but keeping the pathlength the equivalent to image “A,” the concentration doubles and the absorbance value now is A = 14 molecules/cm.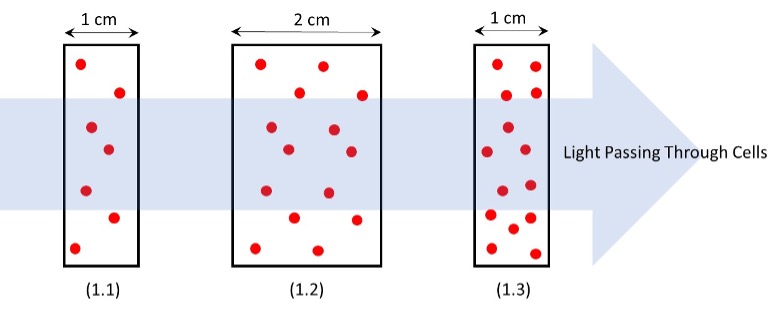 Figure 1: Light passing through spectrophotometric cells of various thicknesses (b) and having different concentrations of H2O2 (C). (1.1) 1 cm cell with 7 H2O2 molecules: A = 7 molecules/cm. (1.2) 2 cm cell with 14 H2O2 molecules: A = 7 molecules/cm. (1.3) 1 cm cell with 14 H2O2 molecules: A = 14 molecules/cm.
The values used for the absorbance in Figure 1 are for illustrative purposes only as the value “A” is unitless. What is being measured in spectroscopy is the difference in light intensity from the starting value (before the light passes through the spectroscopic cell) compared to the light intensity after passing through the sells (see Eqn. 2)
Eqn. 2: A = log(I/I0)
Where I = intensity of light measured after passing through the sample, and I0 is the initial intensity of light.
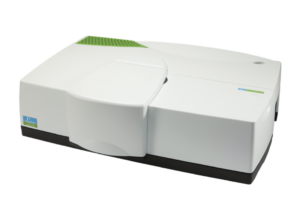
While typical spectrophotometer (such as shown in Figure 2) have path lengths measuring samples from between 1 mm (millimeter) to 1 dm (decimeter) with 1 cm being the ‘standard’ size – the Picarro PI2114 H2O2 Sensor that Synexis uses (as shown in Figure 3) is based on the principles of CRDS (cavity ring down spectroscopy) and has a path length of ~ 14 miles (~23 km).
Figure 2: Image of a Perkin Elmer Lambda 1050+ UV/VIS/NIR (ultraviolet/visible/near infrared) spectrophotometer.
Figure 3: Image of a Picarro PI2114 H2O2 Sensor that is utilized by Synexis to measure DHP concentrations in a gaseous environment.
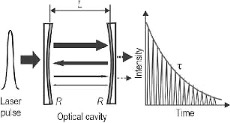
Because of the extremely long path length of sample that light is allowed to pass through (over 1,000,000x greater than the “standard” path length in a spectrometer), the sensitivity of the Picarro instrument is such that low concentrations of H2O2 (down to ~40 parts per trillion) can be measured repeatedly. Figure 4 demonstrates what the cavity of a CRDS instrument looks like.
Figure 4: Diagram showing how a CRDS works. A laser pulse is sent into the cavity that has two highly reflective mirrors. The gas being measured is also in this cavity. As the beam of light passes between these two mirrors, light is being gradually absorbed by the measured gas (DHP) in the cavity – outputting a decay signal of intensity of light as a function of time.
Additionally, because thousands of measurements are made per second, the sensitivity of the technique is also increased due to an increase in the signal-to-noise ratio (SNR, the calculation of which is shown in Eqn. 3):
Eqn. 3: SNR ∝ n/√n
Where n = the # of measurements.
Hence, the more measurements, the greater the sensitivity (SNR becomes larger). Therefore, the two major features that increase the sensitivity of Synexis’ measurement of DHP are (1) increased path length of light through the sample, and (2) increase number of measurements, which increases the SNR.

