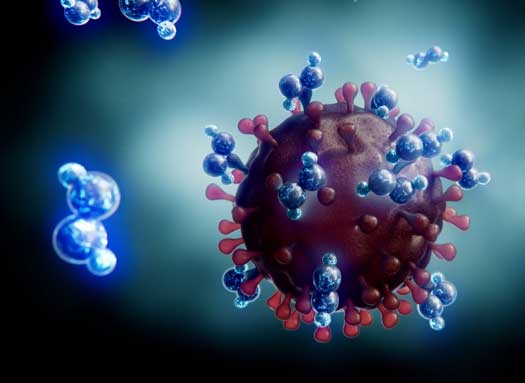
This is Part Three of a four-part series of internal blogs from the Advanced Technology Group to discuss the chemistry of Dry Hydrogen Peroxide (DHP®). This series consists of the following topics:
- Part 1: What is DHP?
- Part 2: Why is DHP more reactive than aqueous H202?
- Part 3: How do we know we produce DHP vs. wet (aqueous) H202?
- Part 4: How do we measure DHP?
We discussed the reactivity difference between aqueous H2O2 vs. dry H2O2 in parts one and two of this series. However, how do we know that we are producing dry H2O2 instead of aqueous versions? Parts three and four of this series will discuss this in detail with today’s entry focusing on the spectral differences between the dry and aqueous versions of H2O2.
Spectroscopy is defined as the branch of science concerned with the investigation and measurement of the absorption or emission of light (and other radiation) by matter. Typically, this is done by measuring the amount of light that a material absorbs or emits as a function of wavelength.
Beers’ Law
The use of Beers’ Law (Eqn. 1: A = εbC) helps in quantifying the amount of material.
In the equation above:
A = absorbance of the material
ε = absorptivity coefficient of the material
b = path length of light going through the material
C = concentration of the material under evaluation
Using this equation, it becomes obvious that the absorbance of light increases (A) when the path length of light going through that material increases (b), the concentration of the material increases (C), or the absorptivity coefficient of that material increases (ε). However, because the last is a constant and is material dependent, that value will not change. This leaves only concentration and path length of light as the only variables leading to an increase in absorbance through changes in either b or C. This becomes important in our discussion in Part 4 of this series.
Absorption Spectrum
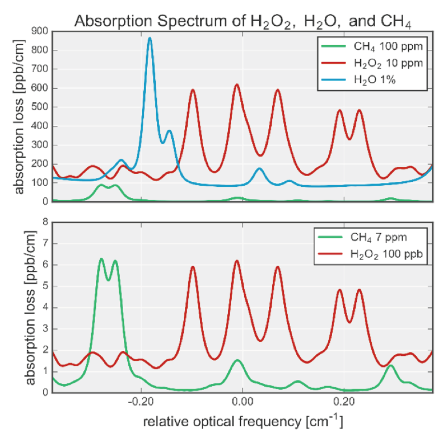
Fourier Transform Infrared Spectroscopy (FTIR) uses infrared light to evaluate a material’s stretching, bending, and rotational absorption bands. In the case of H2O2, it looks at the H-O stretching frequency and is designated as νO-H. Figure 1 shows a graph depicting the absorption frequencies of CH4 (vC-H, methane), H202 (vO-H, hydrogen peroxide), and H2O (vo-H, water). The y-axis shows the intensity of the absorption peak with larger numbers, meaning that more light is absorbed at that frequency.
Figure 1: Graph showing the absorption bands as measured by the Picarro PI2114 H2O2 Analyzer. Top Graph: Shows the absorption of methane (100 ppm CH4) in green, water (1% H2O) in cyan, and hydrogen peroxide (10 ppm H2O2) in red. Bottom Graph: Shows the absorption of methane (7 ppm CH4) in green and hydrogen peroxide (100 ppb H2O2) in red.
What is significant about this graph is the Full Width at Half Maximum Peak Intensity (FWHM) of the peaks that are being measured. In all cases, the FWHM is less than 0.05 cm-1 (where cm-1 is the wavelength) – which indicates that the material being measured are distinct molecules and are not hydrated. Hence, we are looking at the hydrogen peroxide being DHP. Even the H2O molecules are individual molecules and are not hydrogen bonded with each other (see Part 2 of this series).
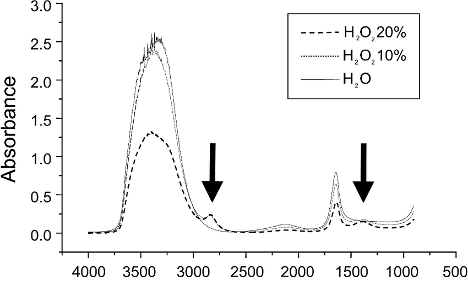
When this is compared to aqueous versions of hydrogen peroxide (see Figure 2), a very different FWHM (>200 cm-1) is measured.
Figure 2: Graph showing the absorption bands of H202 at various hydration levels (10% and 20%). In all cases, the FWHM of the absorption peak @ 3400 cm-1 is >200 cm-1 – indicating that it is forming hydrogen bonds with H2O.

