This is Part 2 of a four-part series of internal blogs from the Advanced Technology Group to discuss the chemistry of Dry Hydrogen Peroxide (DHP®). To recap, this series will consist of the following topics:
- Part 1: What is DHP?
- Part 2: Why is DHP more reactive than aqueous H202?
- Part 3: How do we know we produce DHP vs. wet (aqueous) H202?
- Part 4: How do we measure DHP?
In Part 1 of this series, we discussed what DHP really is and why it is more reactive than hydrated forms of H2O2. We will take a deeper dive into the reactivity of DHP and its benefits over the hydrated versions of hydrogen peroxide.
Relationship Between Energy and Reaction
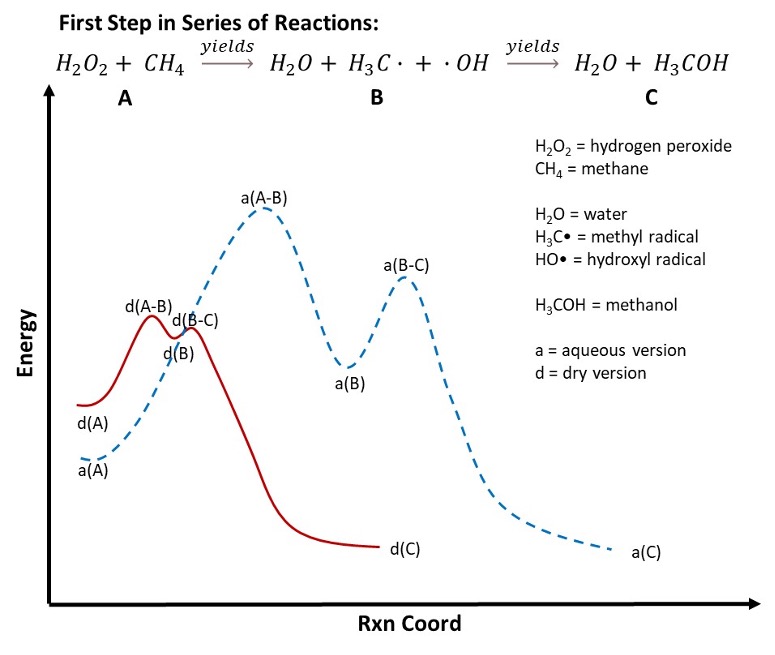
Figure 1 below shows a Reaction Coordinate Diagram, a graph showing the relationship between energy and reaction progress. While this appears to be a simple graph, a significant amount of valuable information is conveyed in this image. First, to define the elements within the graph:
- a: All labels within the graph that start with “a” indicate the reaction progress associated with aqueous versions of H2O2.
- d: All labels within the graph that start with “d” indicate the reaction progress associated with DHP.
- A: This section represents the starting materials, H2O2 (hydrogen peroxide) and CH4 (methane).
- B: This section represents the first intermediate generated in the reaction of H2O2 and CH4 to generate H2O (water), H3C (methyl radical) and OH (hydroxyl radical).
- C: This section represents the final product in the first stage in the reaction of H2O2 with CH4 (the generation of water and methanol [CH3OH]).
Figure 1: Reaction coordinate diagram for the first step in the reaction of hydrogen peroxide (H2O2) and methane (CH4), a known VOC. The solid red line represents the reaction coordinate for the reaction of DHP with methane. The dotted blue line represents the reaction coordinate for the reaction of hydrated versions of H2O with methane.
Second, as mentioned, this graph summarizes a wealth of information. We will cover this information step-wise.
- d(A) vs. a(A): The y-axis of the graph represents the system’s energy. The lower the energy, the more stable the represented feature on the Reaction Coordinate is. For instance, a comparison of a(A) vs. d(A) shows that the aqueous version of H2O2 is more stable than the ‘dry’ version of H2O2 (this is discussed in detail in Part 1 of this series). This is because the aqueous version of H2O2 is stabilized through increased steric hindrance by forming hydrogen bonds with H2
- d(B) vs. a(B): Comparison of d(B) vs. a(B) shows that the intermediate product (methyl radical and hydroxyl radical) is more stable in aqueous conditions, a(B) < d(B). This is because the methyl radical and hydroxyl radical are stabilized through hydrogen bonding or solvation effects, as shown in Figure 2.
Figure 2: Image demonstrating how methyl (left-hand side) and hydroxyl (right-hand side) radicals are stabilized through solvation with water. In both cases, because the radicals are electron deficient, they are stabilized through the interaction of one lone pair of electrons on the water molecule’s oxygen.
- d(C) vs. a(C): Comparison of d(C) and a(C) show that these are equivalent in energy. Both reactions create identical final products (methanol and water).
Third, evaluation of the activation energies associated with each reaction. The activation energy is the amount of energy needed to overcome any barriers associated with the reaction. The greater the activation energy, the more energy is needed to get the reaction to move it forward.
- d(A-B) vs. a(A-B): This is the energy necessary to move the reaction from the initial reactants (H2O2 and CH4) to the intermediate products (H3C and ●OH). The energy needed to initiate the reaction with DHP is less than that required for the aqueous version of H2O2. The reason: Steric hindrance associated with hydrogen bonding of the H2O2 with water. As discussed in Part 1 of this series, H2O2 forms hydrogen bonds with water, stabilizing the molecule through steric hindrance. For the aqueous reaction to proceed, the water molecules surrounding the H2O2 molecule must move – thus increasing the energy needed to initiate any reactions with H2O2.
- d(B-C) vs. a(B-C): As with the previous step, this is the energy necessary to move the reaction from the intermediate products (H3C and ●OH) to the final products (H2O and CH3OH). Once again, the intermediate products are stabilized in water due to solvation effects, meaning that H2O molecules must move out of the way for the reaction to proceed forward. In the case of DHP, because there is no solvation of the intermediate radicals, solvent molecules are not needed to be moved out of the way.
Finally, while the Reaction Coordinate Diagram is not used to represent time when comparing two reaction coordinates against each other (dry vs. aqueous), then the x-axis can be used to represent time loosely. In this case, it should be obvious that the reaction occurs faster with DHP than with the hydrated versions of H2O2. This is because less energy is needed to induce the reactions: d(A-B) < a(A-B) and d(B-C) < a(B-C), and stabilization of the intermediates does not occur with DHP, d(B) > a(B).
Conclusion
DHP is more reactive than aqueous H2O2 due to:
- Steric hindrance of H2O2 when hydrogen bonded with H2
- Stabilization of intermediates by H2O by stabilizing radicals with one of the lone pairs on the oxygen atom of H2O under aqueous conditions.


